


Swing Trading Crypto - The ultimate guide
Crypto swing trading is a trading style in which the trader opens and closes cryptocurrency trades usually within a few days, and usually never stays in a position for more than 2-3 weeks. Swing trading is very distinct from day trading, where the trader essentially sits in front of a computer screen and looks for opportunities to get in and out of trades within the same trading day.
Day trading is a recognized trading style and there are people who actually make a living from it. However, in my 14 years of involvement in the financial markets, I have come to see that most of those who succeeded in day trading were able to do it in the stock market, less so in the forex market, and hardly in the cryptocurrency market. Why is this so? Cryptocurrency trading is extremely risky and the price movements can sometimes be really crazy. Moves of up to 400% to 700% in a single trading day have been known to occur. If you are able to get on the right side of such trades, you get to smile to the bank. But if you get it all wrong, you could be wiped out in an instant. You should also know that for such an emotionally charged activity as financial trading, seeing the price candles swing up and down in wild whipsaws is not a very pleasant experience. Swing trading helps you avoid all this.
Swing Trading Cryptocurrency - the main advantages
- 1.) You are not under pressure to keep chasing pips all over the place and staring at your computer screen all day long. Health experts will easily tell you that staying on a computer screen for so many hours in a day is bad for the eyes.
- 2.) The structure of swing trading means that you only need to take a few trades within a monthly cycle. This allows you to pick out the best possible opportunities and not allow the gambling mindset to take over.
- 3.) You are able to chase high reward trades. Acceptable risk-reward ratios should be a minimum of 1:3, allowing you to target making 3 pips for every 1 pip you risk. Swing trades can give you this leverage, as will be seen in the example we give in the article.
- 4.) Swing trading is less time consuming and leaves you with precious time to do other important things in life.
- 5.) Most importantly, swing trading levels out the risks associated with the intense volatility of the cryptocurrency market.
Techniques of Swing Trading
Any type of trading usually has to factor in the news (fundamental analysis) as well as the price patterns and setups that are seen on the charts (technical analysis).
Crypto News Trading
The news is what determines the long term trend of any asset, and cryptocurrencies are not an exception. Trying to trade the news spikes (which is the case in day trading) is a risky affair for retail traders, as they do not have the tools that are available to the bigger players in the market. However, trading the news with swing trades usually involves trading the wider perspective provided by such a news release. Such perspectives usually play out when the market has been allowed to digest the news content, leading to a more sustained and predictable response. It must be mentioned that there is no economic news calendar for the cryptocurrency market. In the absence of scheduled news releases as we see in the forex market, the cryptocurrency market and the assets contained therein are therefore subject to a totally different set of news items.
Cryptocurrency Brokers
So what are the most important news events that can shake the cryptocurrency market?
- Government announcements regarding regulation or legalization of cryptocurrencies have proven to be the greatest crypto market mover as far as the news is concerned. We have seen very big moves in the cryptocurrency market following announcements such as those made by governments in China and South Korea banning cryptocurrency activity at various levels in their jurisdictions.
- Hackings and closures of cryptocurrency exchanges is another major market mover, and such news usually has a negative effect on the market. The hack and subsequent closure of Mt.Gox in 2014, as well as various hacking incidents of exchanges in South Korea and other parts of the world, have all had news implications on the cryptocurrency market.
- News from within the major cryptocurrencies can also move the market. TRON saw a 2-fold increase in price when the CEO, Justin Sun, announced plans to launch the BitTorrent Token (BTT) on the TRON network, with TRX holders being allocated some of these tokens in the form of an airdrop. This caused some demand for TRX tokens, leading to a rise in its price.
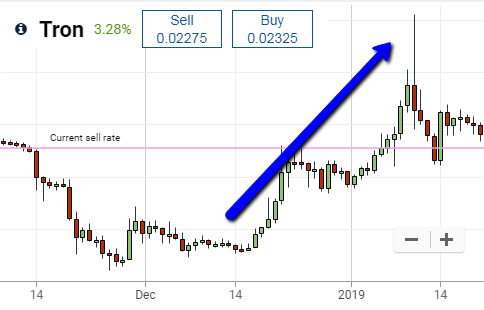
TRON (TRX) Daily Chart Showing Price Increase on News of Launch of BTT
- Technology upgrades within a cryptocurrency network can also be news worth following. TRON has seen some growth in its share price after announcements by its CEO showed that developers were gradually taking to its new network to develop decentralized applications (dApps). The ongoing success of one such dApp known as TRONBet is well documented.
- Cryptocurrency airdrops and new listings of coins on an exchange are less important but sometimes useful news events to follow.
These news items can usually be sourced from well-known cryptocurrency news sites, as well as on the Twitter pages of some of the crypto networks in question.
Crypto Technical Analysis
A commonly used market mantra is:
“trigger fundamentally, but enter technically”.
What this simply means is that you ought to use fundamental analysis (i.e. the news) to predict the market direction, but you use technical analysis to derive the exact points at which to enter and exit your trades, following the direction of the news. Technical analysis is really a very wide discipline, but it is crucial for anyone who wants to trade to have at least some rudimentary knowledge of what it entails. Technical analysis involves the use of price patterns, indicators, candlestick patterns and other chart information to make a decision on which direction trades should follow.
The technical analysis draws its entire functionality on three basic premises:
- The market action discounts everything.
- Prices move in trends
- History repeats itself.
What does it mean for the market action to discount everything? It means that everything that occurs in the market is accounted for in the price. Therefore the price is the result of the demand and supply dynamics in the market, and these dynamics are also end-products of the biases and sentiments that market players show in response to the fundamentals of the asset. So narrowing it down to cryptos, we can safely say that price activity on any crypto coin is a function of all the factors that have dictated the sentiment of market players, who have therefore decided to act, thereby causing a demand push on the market, or creating a supply reaction as well.
Prices move in trends because when the majority of market players have taken on sentiment, they will act out that sentiment in a form of herd action by either buying or selling. Buying will create a demand, which leads to more buying and this pushes prices upwards. At this time, prices will be in an uptrend. Take the Tron scenario mentioned above as an example. This Tron news forced a buying sentiment in the market, created a demand for Tron, and this led to a lot of buying which has driven the TRX coin into an uptrend. Similarly, when there is less demand for an asset, those who owned it will decide to dump it in the market, creating an oversupply and therefore a fall in prices. This will send the affected asset into a downtrend, as we have seen for Bitcoin in the last year.
History repeats itself because traders will react to a particular situation in the same way that they reacted to the same situation in times gone by. Therefore, if we see a pattern where there are progressively lower highs, converging on horizontal support (i.e. a descending triangle), we will see traders react in the same way as they did when this setup occurred historically. This is actually the basis for trading chart patterns such as triangles, wedges, head & shoulder patterns, flags and pennants, etc. History repeats itself because human beings are emotional beings who will reproduce the same reactions to an event or a situation as they did in the past.
What It Takes to Succeed in Cryptocurrency Swing Trading
In order to achieve some measure of success when swing trading bitcoin and altcoins, you have to ensure that the following factors are sorted out.
You must have a good trading strategy.
You must have good risk management in place.
You must have good trading psychology
You must be able to document your progress by keeping a trade journal.
How to develop a crypto swing trading strategy
What are the possible strategies you can use for crypto swing trading? Your strategy should include a checklist of questions you must answer before you take on a trade. The following checklist was developed by master technical analyst John Murphy and is detailed in his book “Technical Analysis of the Financial Markets”. According to this checklist below, traders must find out the following:
- Overall market direction.
- Key points from the monthly, weekly and daily charts.
- Trends that are playing out (up, down or sideways trend?)
- Where the important support and resistance areas are.
- Presence of any chart patterns, trendlines and channels.
- If there are chart patterns, are they continuation or reversal patterns?
- Fibonacci levels and retracement points.
- Volume patterns.
- Elliot wave patterns on the chart, if any.
- Presence of any tops/bottoms.
- Is price overbought or oversold? What do the momentum indicators say?
- Any market correlations at play.
When you have determined where you think the market will go, you must then determine the following:
- If you will buy or sell the market.
- Your trade size.
- Your risk i.e. how many points you intend to set as stop loss.
- Your profit target (i.e. Take Profit).
- Your entry point
- The type of order you will use to achieve your entry (market or pending order).
Risk Management
Risk management is a strategy that ensures that if you sustain a string of losses, you will still have enough capital to stage a comeback. Risk management also attempts to nullify the effect of losses on your account by adopting a good risk-reward ratio for setting up trades. So how should you handle risk management?
Using Good Risk-reward Ratios
The first risk management strategy is to ensure that you only take trades that offer a 1:3 risk-reward ratio as a minimum. In other words, you should be aiming to make 3 pips for every 1 pip you set as a stop loss. This ensures that it has to take 3 losses for every winner to set you back to break even. The higher the reward for the risk taken, the more protected you are, as it will have to take more losing trades to nullify your winning trade. For instance, if you use a risk-reward ratio of 1:4, it means that you can target 200 pips for every 50 pips risked in the stop loss. If you use this setting and trade 7 times in a month with 2 winning and 5 losing trades, you would have made 400 pips as a reward, and lost 250 pips as a risk in trade carrying a stop loss. This leaves you with a profit of 150 pips, despite the fact that more trades were lost than one. This proves that using high ratios of reward against risk is a good risk management strategy.
The 3% Rule
This rule refers to the risk exposure of an account in terms of margin used in open trades. The margin requirement (i.e. capital required to set up a trade position) of all trades that are active in the crypto market should not exceed 3%. In the EU, the new rules on margin stipulated by the European Securities and Markets Authority (ESMA) have pegged leverage for cryptocurrency CFD trading at 1:2, or 50% margin which all big reputable European brokers respect. So how can the 3% exposure rule be applied in a trading environment where leverage is 1:2?
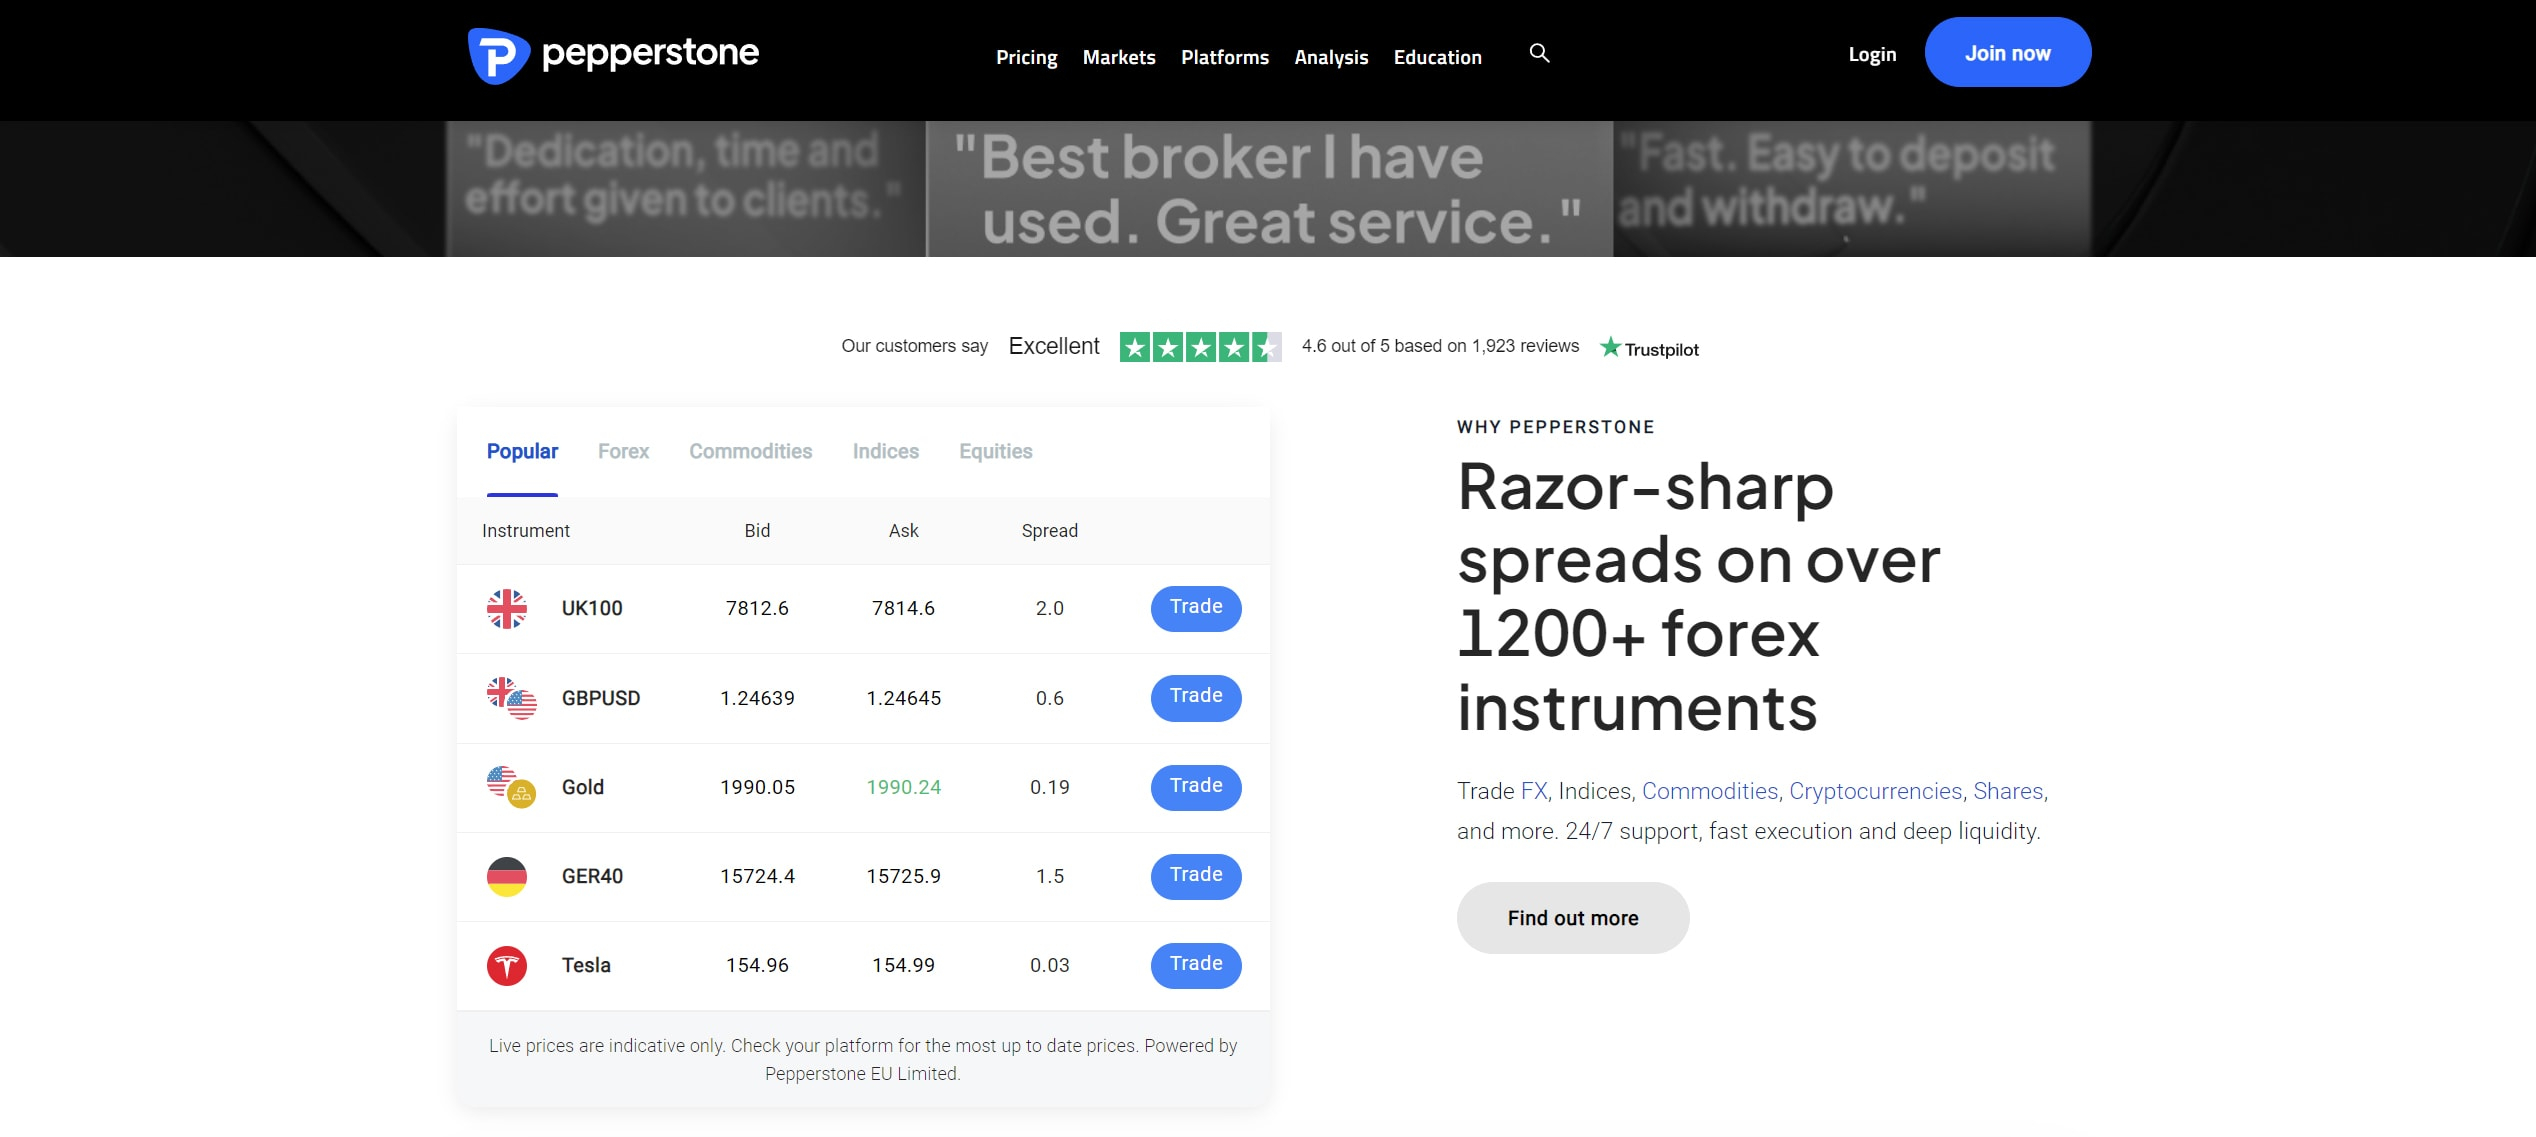 Here is an illustration of how to apply the 3% rule using Pepperstone, a popular broker regulated across 3 continents, which provides crypto trading at a 50% margin. Cryptocurrency positions are generally very expensive to set up, as the spread of some crypto assets such as Bitcoin is very large. For instance, on the date of writing this post, the minimum spread for Bitcoin is on Pepperstone $10, which is actually in comparison to other crypto brokers in the industry highly competitive.
Trade Example from 2019
Question: Bitcoin had been in a downtrend from January 2018 after peaking at $19,800 per coin. Discuss one rational way to execute a trade to follow this downtrend.
]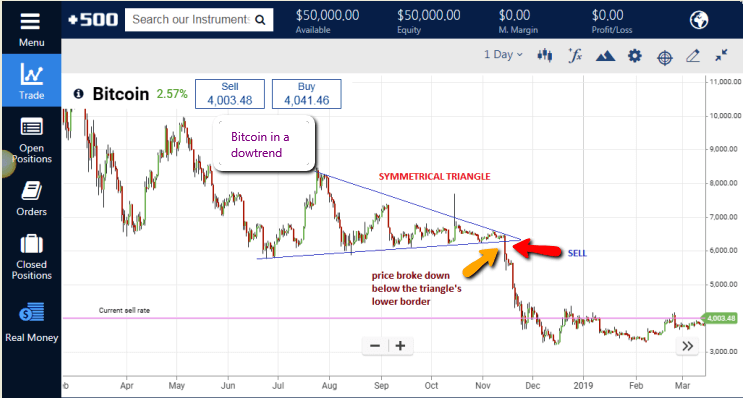
Daily Chart for BTC/USD
Answer: Looking at the daily chart shown above, the following things stand out.
- There is a symmetrical triangle that had formed between June 2018 and November 2018, which marked a period of price consolidation within the context of the downtrend from January 2018’s price of $19,800.
- The symmetrical triangle is identified in technical analysis as a continuation pattern, meaning that in a downtrend, the price is expected to break below the symmetrical triangle’s lower border.
Armed with this information, the trader would have been expected to do the following:
-
Look for a good entry point for a SELL trade, to track the downtrend. This is seen at an area close to the apex of the triangle, where a price candle moves below the lower border of the triangle and closes below it.
- In a downward breakout move, the volume is not important as prices naturally tend to head south without much pressure, once there is bearish sentiment in the market.
- The stop loss in this example would have been set a few pips above the triangle’s lower border, within the triangle pattern itself.
- The profit target would be set at an area where the price is likely to encounter support, and this must be at least three times the distance between the entry price and the stop loss, to achieve a 1:3 risk-reward ratio.
- A look at the weekly chart (not shown) would show that historically, the price had found support at the $3,500 to $4,000 mark. This was the area where the price found its support after it fell from the $7,500 mark, following the news of China’s cryptocurrency ban.
- Risk management following the 3% rule should be observed.
The outcome was a continued downtrend which would have put the trade in a position of significant profits. This is an instance of how a chart pattern can be used to initiate a swing trade in the crypto market.


Top-Tier Trusted Brokers
The table below contains links to 3rd party websites of our top partners from whom we receive compensation at no additional cost to you.