3# Crypto Chart Patterns for Day Trading you should be using
This article will discuss the patterns that are available to you to trade cryptocurrencies on an intraday basis.
What are Crypto Patterns?
The phrase “crypto patterns” as used in this article, refers to the chart patterns that are formed by price action on various cryptocurrency assets. For this article, we are mostly interested in patterns that the trader can use to get into and out of trades profitably within the course of one trading day.
Some Points to Note
There are several chart patterns that occur in the financial markets. However, there are very few you should be concerned with. These are the crypto patterns that will be described here. But before we continue, it is pertinent to mention that these crypto patterns for day trading do not work in isolation. They have to be used within the context of some tools as well as time-tested methods of technical analysis. The tools we shall be using are:
- a) Volume bars
- b) 50-day exponential moving average (optional)
- c) Pivot points.
Traders who day trade have to deal with one big problem; market noise. There is a lot of choppiness that occurs on intraday trades, and these cannot truly determine a trend. Therefore, day trades have to be made in the direction of the overall trend. This means that you will be best served looking at the trends on the weekly chart, then the daily chart before the trading decision is taken on the hourly chart. That way, your trades align with the trend and not against it.
We should also mention that patterns that lead to downside price movements tend to be more aggressive than those which result in upward movements. Furthermore, the patterns that lead to upward price movements typically need to see significant buying volume, whereas crypto patterns that lead to bearish moves do not need confirmation from increased selling volumes.
For this reason, we will only focus on patterns that end up in downward price moves. The price moves are larger and can potentially give you more profit. Picture yourself climbing up the stairs and coming down from a staircase: which is easier? If you have the answer, then you have understood why we only want to focus on patterns that will drive prices downwards.
Three Crypto Patterns for Day Trading
The 3 crypto patterns which we shall discuss are these:
- a) Triangles (symmetrical and descending)
- b) Bear flags and pennants
- c) Wedges (rising)
How can these crypto patterns be exploited to provide a profitable day trading experience? Descriptions and illustrations are shown below.
1. Triangles
There are three types of triangle patterns you will see on a crypto chart. These are symmetrical, ascending and descending triangles. Symmetrical triangles are made up of two converging trendlines, each traced on the highs and lows of price action respectively. The symmetrical triangle is seen as a neutral triangle, as the resolution of the triangle tends to follow the direction of the trend that prevailed in the market prior to the formation of this triangle. A symmetrical triangle holds a price in consolidation.
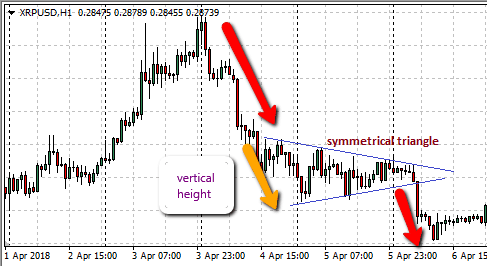
Symmetrical triangle
This picture was taken from an hourly chart. We see the price trending downwards, then captured within the symmetrical triangle, before breaking below the triangle. As a rule, the extent of the price move below the triangle is virtually the same distance as the vertical height of the triangle.
Then we have the descending triangle. Here, there is a horizontal lower trendline and a downward sloping upper trendline. The resolution for this triangle is a downward break of price, leading to further bearishness. I like this pattern because the price moves are always very aggressive.
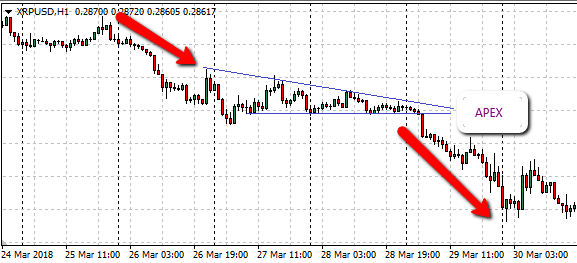
Descending Triangle
Notice how far price fell after breaking below the lower border of the descending triangle. This kind of setup usually produces great results for the trader.
2. Bear Flags/Pennants
Flags and pennants look just as they are called. Flags and pennants usually have a segment where price forms a flag-pole; this is the predominant trend. This is followed by the consolidation of a price that forms either the flag or pennant. Trendlines that enclose the consolidation area either converge to form the pennant, or form parallel lines to form the flag.
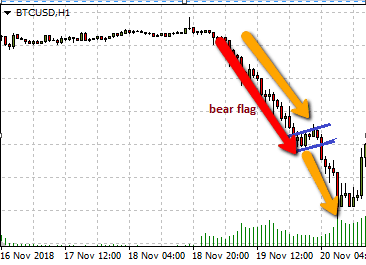
Bear flag
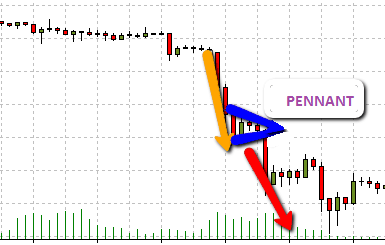
Bearish pennant
3. Rising Wedge
A rising wedge has two upward-sloping borders, with the lower border being the steeper of the two. Look at this chart. Notice how price still breaks out of the pattern even in the absence of noticeable volume.
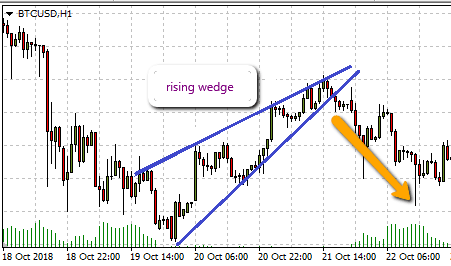
Rising wedge
As the price heads towards the point of convergence, the price eventually breaks below the pattern.
We have seen that these three crypto patterns for day trading all scream: BREAKOUT. So what is a breakout?
The Concept of the Breakout
Critical to the trading of these patterns is the breakout. Breakouts usually follow periods of consolidation, and the patterns described above represent periods of consolidation. To trade the breakout, you have to do the following:
- a) Identify and trace the highs and lows of the consolidation. In other words, trace the patterns on the chart.
- b) Identify the break.
- c) Perform the trade.
a) Pattern Trace
Connect the price highs with one trendline, and the price lows with another trendline. These trendlines must connect at least three highs/lows to be valid. The trendlines will form the borders of the patterns.
b) Identifying the Breakout
If the price bar/candle extends beyond the pattern’s borders, but ends up closing within the pattern, this is not a breakout. It is called a false break or fakeout. So you have to allow the candles/bars to close first before you can determine if a break of the pattern has occurred. A candle with a false break will, therefore, have a shadow, which is a sign that those market traders opposing the break were successful.
A true break will see the price candle closing beyond the pattern’s borders. Only when this has occurred can you trade in the breakout direction.
c) Setting the Trade
Sometimes, price attempts to go back to within the pattern. A broken pattern border will reject this move. So a Limit order is the best that can be used, as it gives away far less pips to the market following a breakout. The Limit order is set to the price that corresponds to the broken pattern border for maximum profit. Since our patterns are those that result in downside moves, we will use Sell Limit orders.
So pay attention to these patterns and practice with them.

Top-Tier Trusted Brokers
The table below contains links to 3rd party websites of our top partners from whom we receive compensation at no additional cost to you.