Commodity trading guide for beginners – Basics
We come in contact with commodities such as coffee, milk, sugar or gas every day of our lives. Commodity trading in form of buying goods in exchange for money has been going on for centuries, but it is only now that commodity trading has become an extremely popular way to speculate on rising and declining prices of commodities. In this guide, we will cover the basics of commodity trading.
Basics to know about commodities
A commodity is a good of uniform quality and value that is delivered to the market by multiple suppliers. That means the price of one crude oil barrel is on the market exactly the same no matter where it comes from. Thanks to the interchangeability of commodities, the value of commodities can be quoted at one specific unified price. So, if you inspect the current value of Brent oil, you know you can trade it for the following price:
Commodity types
We divide commodities into two main categories – hard and soft commodities. The former is in most cases mined while the latter is grown or bred. Here is the basic distinction of commodities:
Hard commodities
- Metals (e.g. gold, silver, platinum and copper)
- Energy (e.g. crude oil, heating oil, natural gas and gasoline)
Soft commodities
- Livestock and Meat (e.g. lean hogs, pork bellies, live cattle and feeder cattle)
- Agricultural (e.g. corn, soybeans, wheat, rice, cocoa, coffee, cotton and sugar)
How to trade commodities?
Traders who do not want to physically own any commodity and want to just speculate on commodity exchange rates can trade CFDs on commodities (see a trade example). CFD trading is done through online trading platforms that are accessible via just a web browser. Thanks to CFDs, executing commodity trades is no longer complicated and unattainable. One can trade CFDs on commodities, Options, Exchange-traded funds (ETFs) and Stocks.
-
a) Commodities
CFD on commodities is usually possible to trade with up to 1:10 leverage with the single exception of gold which can be traded with up to 1:20 leverage. CFDs mirror the current value of commodities at which they are quoted on the market. When trading CFDs, you physically never own the commodity. This investment type is used just for speculating on future price developments. It is possible to go for long positions (when you predict the prices will go up) as well as for short positions (when you forecast the prices will decline). -
b) Options
Options CFDs on commodities can be traded with up to 1:5. This financial instrument gives you access to trading Call and Put options that you can “buy” or “sell”.
-
c) ETFs
ETFs CFDs, exchange-traded funds, can be traded with up to 1:5 leverage. ETFs are managed by fund managers who decide what assets will be featured in the portfolio. Commodity ETFs can follow a single commodity (e.g. iShares Silver Trust), a basket of commodities (e.g. OIH-Oil Service), or a commodity index (e.g. Commodity Index Fund).
-
d) Stocks
CFDs on stocks can be traded with up to 1:5 leverage. There are many popular companies that have a direct connection with the commodity market (E.g. energy - CEZ, steel - United States Steel, hydrocarbon exploration - Pioneer Natural Resources) etc.
What fundamentals drive commodity prices
Commodities are very dependent on supply and demand. If the supply is disrupted and the demand is consistent the prices swing up. If the demand decreases and the supply is steady the prices go down. The following patterns apply at all times.
Demand > Supply = Higher Prices
Supply > Demand = Lower Prices
Here are the main fundamentals that move the commodity market sorted into 4 main categories:
Metals
When discussing fundamentals that affect metal prices, we have to closely inspect the use that each individual metal has. Base metals such as iron ore, copper and aluminium stay at the forefront of global industrial production while precious metals such as gold and silver are primarily used for jewellery and retaining value.
Base metals and their prices are mainly driven by demand in superpower countries. The biggest player in this game is no other country but China that accounts for half of global base metal consumption. If the Chinese economy slowdowns, the demand for base metals will take a hit and the market reacts accordingly. Other world’s biggest base metal consumers we should monitor are India, Russia and South Korea.
Precious metals, especially gold and silver, are regarded as safe haven investments. The reason being is because the supply is limited while the demand is generally constant. The prices of these two precious metals tend to have an inverse relationship with interest rates and with the world currency, the US dollar. Although not all precious metals react to economic downturns in the same way, their prices have a strong habit of surging.
Precious metals are already widely used in electronic components due to their unique irreplaceable properties. For instance, if you have a computer, be certain of the fact that you would find in it bits of gold, silver, platinum as well as palladium (e.g. in a printed circuit board, computer chips, hard disks). If an important announcement comes to light about new uses of precious metals in electronic components, the demand will increase along with the prices of these metals.
Energy
The energy commodities are unique as their prices can affect pretty much all other markets, including all commodity sectors. That is simply because if transportation costs grow, so do the prices of metal, livestock, meat and agricultural commodities.
The heavyweight champion of the energy sector is oil which accounts for 43 percent of the world energy consumption. The oil prices are based predominantly on economic growths. That means if the economy is in good shape, there is more need for oil as people are using more cars, electricity, heat etc.. On the other hand, if there is instability on the market and financial crisis might occur, the oil prices will be the first one to take the hit.
The oil supply and with it also its price might be at risk when there is a major political tension in the countries where oil is being mined (or in countries that greatly import oil from these countries). There is only a limited number of oil-rich countries, to most parts of the world crude oil is being transported. When the constant transportation is disrupted, the oil price reacts accordingly. For that reason, oil traders need to be on the watch out for important pipeline and canal explosions, for workers going on strike etc.
Livestock and Meat
The livestock and meat prices are dependent on the prices of corn, milo, barley, oats and other agricultural commodities that cattle consume. Their exchange rates are also influenced by severe weather conditions or cattle diseases. Did you know that cattle can consume during cold winters up to 50% more feed to stay warm? That is a true fact as is that during extremely hot summers, the cattle are in danger of overheating which can result in poor breeding efficiency and weight gains or even deaths.
The prices of different types of meat are correlated. Meaning, that if the prices of pork suddenly increase, the demand for beef rises, causing price hikes of beef. If there are concerns about the quality of some meat, it can drastically influence the import as well as export. Take the case of Polish chickens as an example. 3 tons that contained the bacteria of Salmonella Enteritidis were exported to the Czech Republic causing a huge boom in about every newspaper and media in the country. Ever since this incident, Czechs do not trust chickens that are produced in Poland and they rather pay more for chickens that come from Czechia.
Factors which can drive meat prices down are also definitely any technological enhancements that can help robotize the work farmers and ranchers do or anything that can improve the reproduction of cattle. Commodity traders who focus on the meat sector should also look out for government programs or grants of important cattle production countries.
Agricultural
Agriculture has always been at the mercy of the mother of nature as the most influential element is nothing other than the weather. Droughts, floods and other severe weather conditions can influence the quality of crops or completely ruin the harvest. That is why almost all agricultural commodity traders monitor weather forecasts to more precisely forecast the next crop yield.
The need for more corn, soybeans, wheat, rice etc. is also determined by changing demographics and changes in diet. According to the former White House Press Secretary Sean Spicer, global food demand is expected to increase by 50 to 97 percent by 2050. With this in mind, take into consideration that more and more people are migrating from rural to urban areas where they earn more income. If there were no other fundamentals (there is the "if" again...), this data alone would suggest the prices of agricultural commodities have to rise over time.
With respect to elements that can drive agricultural prices down, we have to mention high-tech innovations. That covers anything from genetically altered seeds that require less water to driverless tractors that help automate farmers’ work. It is also good to look out for any government programs or grants for agriculture developments that could be implemented to boost agriculture in the country (e.g. Farm Bill Programs).
3 most popular traded commodities in the world
Crude oil, or the black gold, is the most popular commodity out there. It is the major source of fuel and energy for the world that is used across all major industries. The most typical products are gasoline (used to fuel cars), heating oil, diesel fuel and propane. If you thought you use crude oil just when you are fueling your car, let me set you straight. As a petrochemical product, it is commonly used when making plastics, isolations, paint, cleaners, and lubricants (e.g. machine and motor oil). There is no end to the list of things in which crude oil is being used.
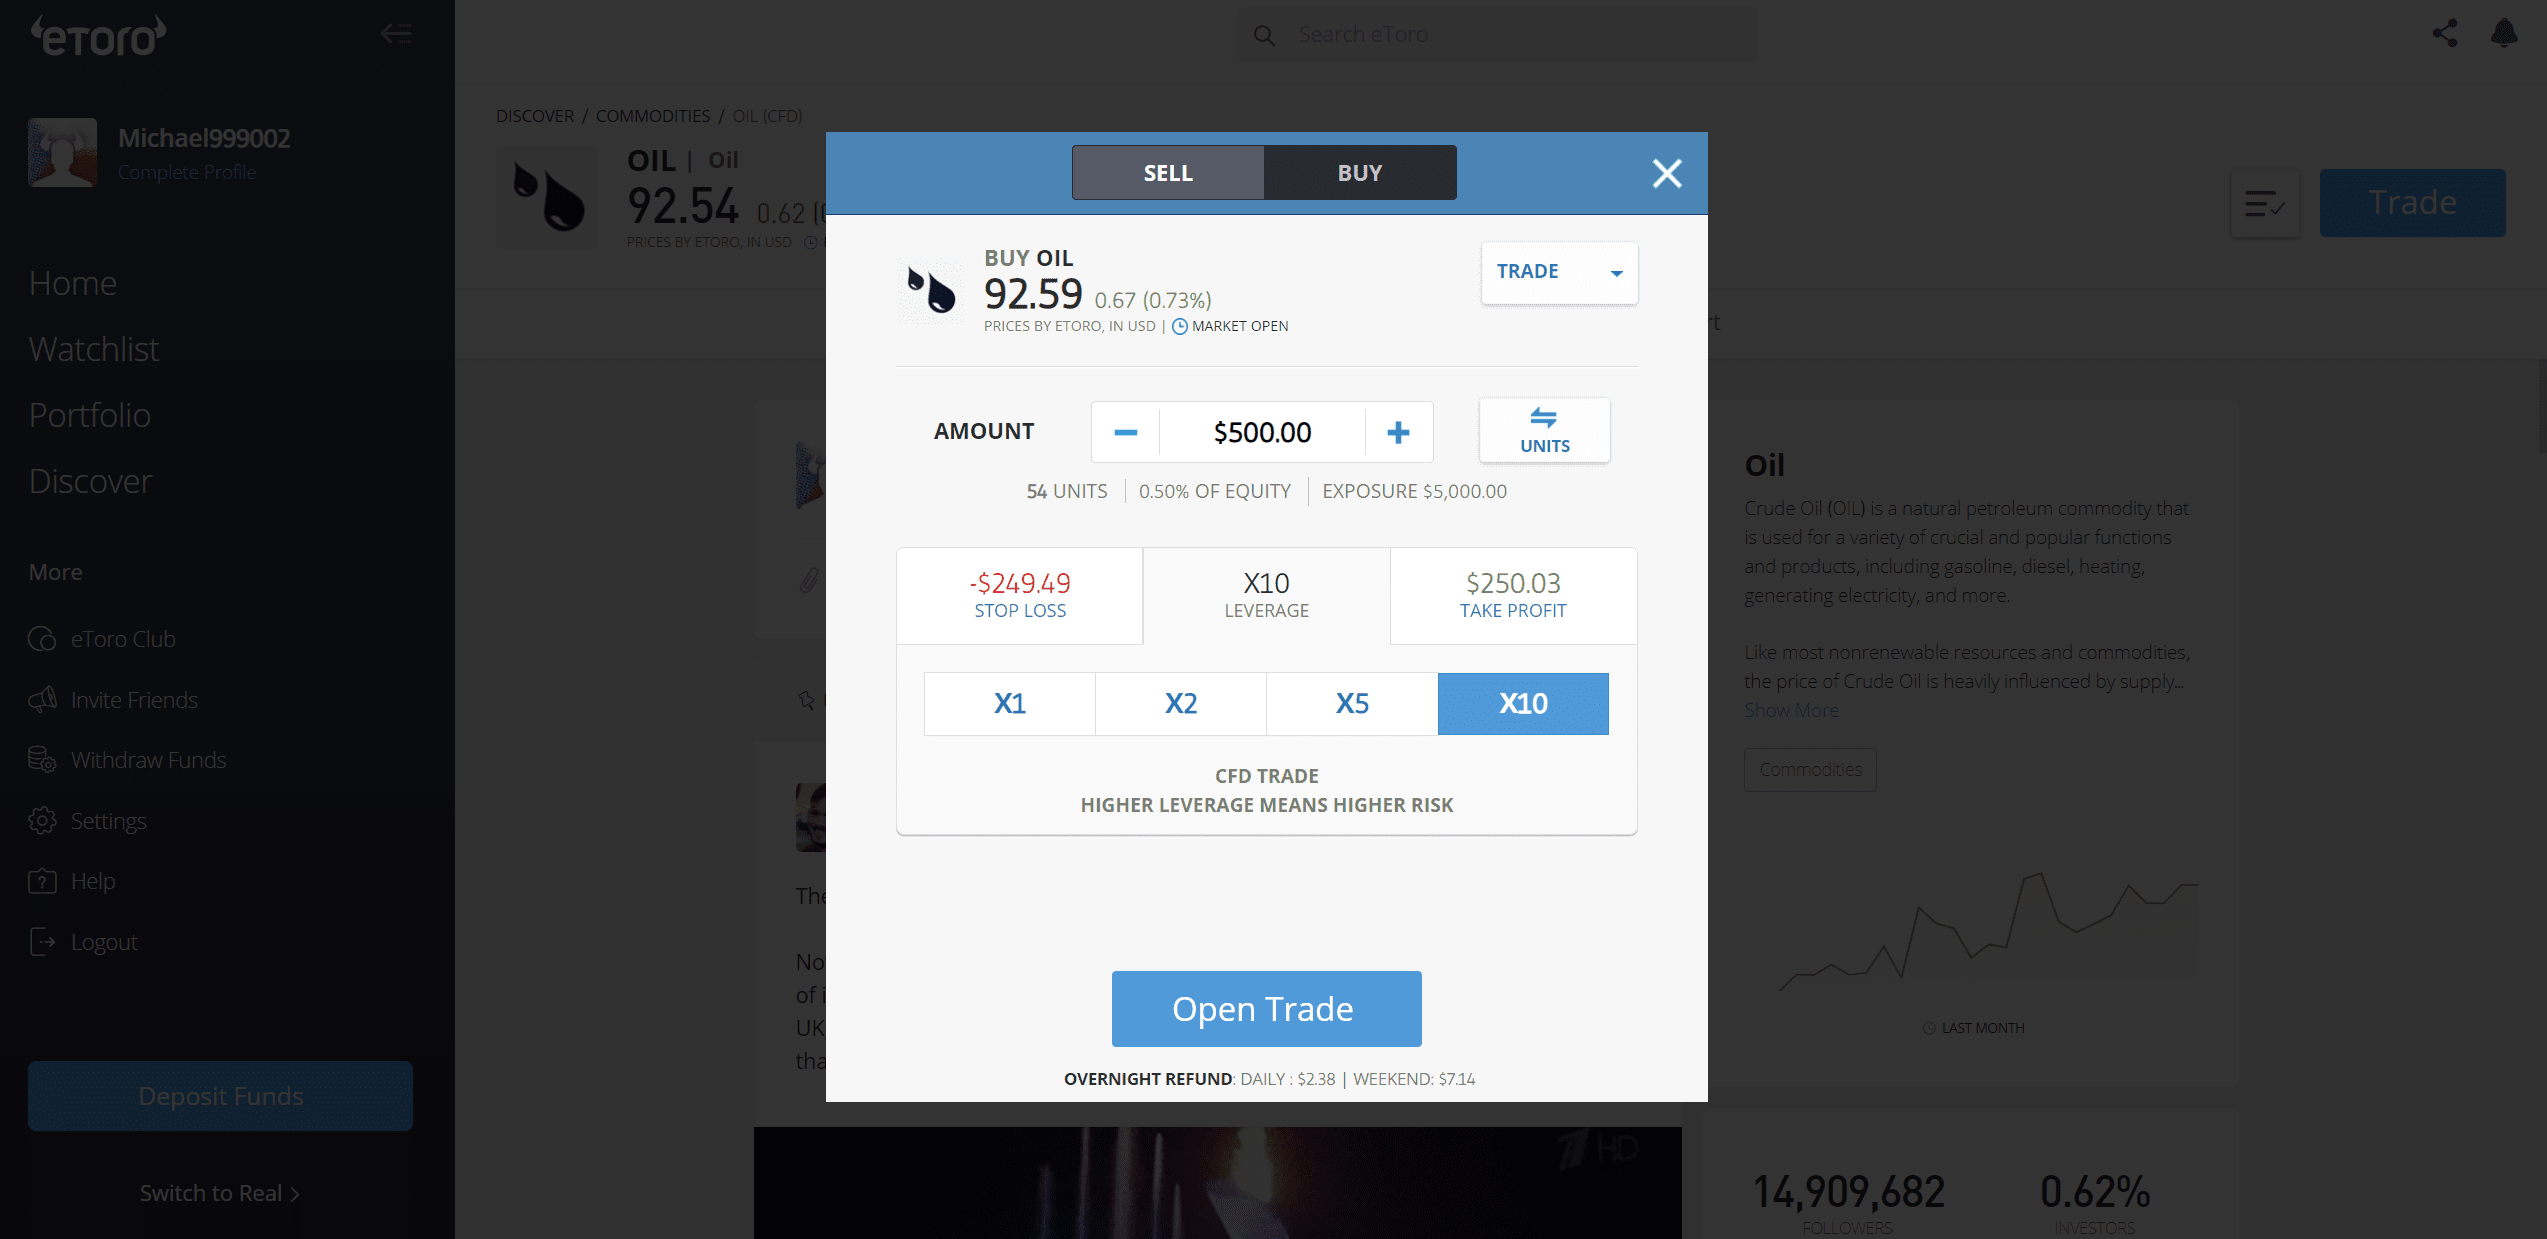
Oil trade example
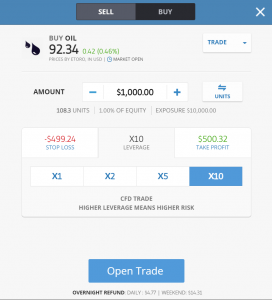
 The eToro platform displaying an Oil trade. Illustrative prices.
To demonstrate how easy it is to open CFD trades on commodities we chose a popular trading platform eToro. This company supports CFDs on commodities with customizable leverage (x1, x2, x5, x10). For our trade example, we selected Brent Oil, one of the most popular commodities out there. This commodity, is, of course, traded against the USD.
Once you are logged into the platform, as we are, you can predict whether the price of oil will go up ("buy position") or down ("sell position").
 The minimum position size for oil is at eToro 100 USD, however, this amount is due only if you use 1:1 leverage. In case you use 1:10 leverage, you will have to pay only a 10% margin. So in practice, if you use 1:10 leverage the minimum investment for opening a position on Oil is 10 USD.
In the shown trade example, we chose to buy CFD on Crude Oil worth 1000 USD. And we used 1:10 leverage. Thanks to this leverage, we receive CFDs on 100.75 barrels of Crude oil. If we used no leverage (1:1), our trade would have only the strength of 10.75 barrels. This means we receive 10 times bigger profit if the price goes up, consequently, we also lose 10 times more if the Oil prices go down.
Let's run a quick scenario of how your profits or losses would be calculated. If you purchased CFDs on 100 barrels of Brent oil at the current exchange rate of $92.34 per barrel and the price changed to $93.34 per barrel, you would make $99.5 on your investment (Close 'sell' rate - Open 'buy' rate) X amount of contracts; ($93.34-$92.34) x 100 barrels = $100. From this amount, we have to deduct the spread fee (the difference between the buy and sell price at eToro), which is in our case 0.05 spread x 10 leverage = $0.5. If you closed the trade, your account balance would be $99.5 (profit) + $923.34 (investment) = $1022.84.
If the Brent oil prices dropped to $91.34 per barrel and you would instantly close the trade, you would lose $100.5 on your investment ($91.34-$92.34) x 10 = - 100$ - $0.5 spread fee). So from the initial investment of $923.34, you would have $822.84.
This calculation does not factor in a scenario where the trade would be open overnight. Should that be the case, you also have to factor in the overnight funding fee.
COT Reports
To make futures trading more transparent, every big player in the game has to report opened positions on commodities, metals and forex. COT or Commitments of Traders report aggregates all these positions and provides us with very handy data which we can use when trading commodities. The COT report is released every Friday at 3:30 Eastern Time and reflects the market status of the previous Tuesday. That means during the weekend, most commodity speculators analyse data from the COT report, so they would be ready for the next commodity trading week.
To download the most current COT report, you can visit the website of the Commodity Futures Trading Commission (CFTC)- https://www.cftc.gov/.
How is the COT report broken down
The COT report provides data about all long and short positions that the following 3 main groups of commodity traders have taken:
- 1. Commercials (Hedgers)
- 2. Non-Commercials (Large Traders)
- 3. Non-Reportable (small speculators)
The most important group to focus on is commercials. They are the ones who know the market in and out and know when the commodity is expensive or cheap. Commercials usually hold the biggest positions and the two other commodity trader groups tend to follow them. Unlike the two other groups, hedgers have an interest in physically owning the commodity they trade.
The second most important groups are non-commercials (e.g. hedge funds), these guys are in the market just to make bucks from price speculations. After commercials, they hold the biggest positions. They are considered to be less knowledgeable than the first group of traders.
The last group of traders – Non-reportable are small players that are regarded as the least experienced in the market. It is not recommended to copy their positions.
How to work with COT reports
Once you open the most recent COT report, an alike table will appear.
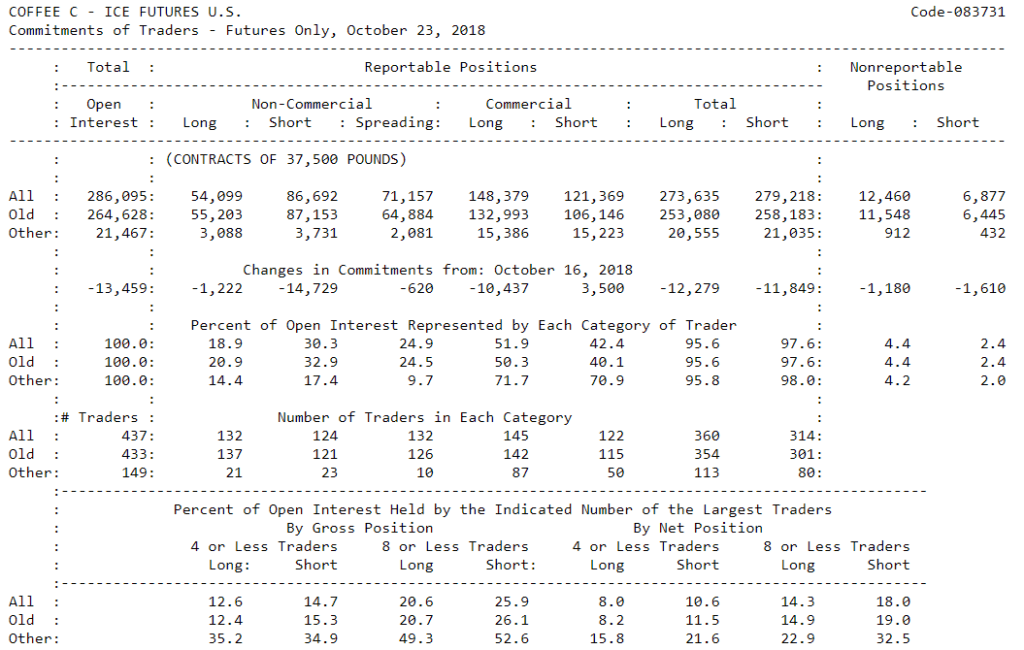
As you can see there are a lot of numbers and navigation in the report is not particularly easy. After staring at the table for a while you will, however, be able to find how many short and long positions traders have taken or what is the open interest rate (number of contracts that have not been settled). Nevertheless, all this information is not really important. Or at least unless we put it on a time scale. This helps us to more clearly see the sentiment of the market and how it has changed over time. For this purpose, you can use any analysis tool that supports the TOC indicator. I personally use spreadcharts.com, which features the TOC analysis on its platform (free of charge).
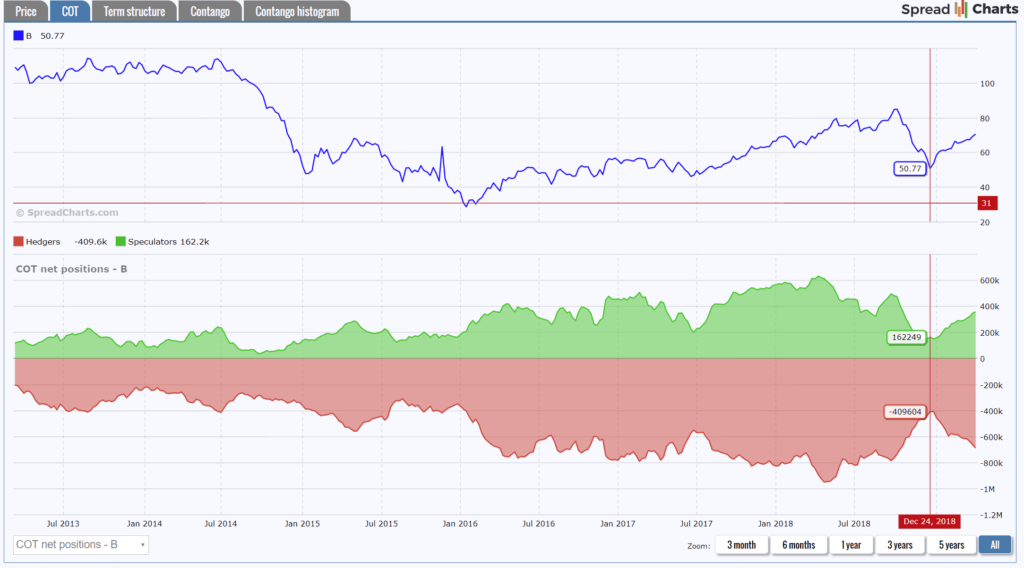
A chart displaying the positions of hedgers (red) and speculators (green)
If we put the data from the chart above into historical context we can find out whether the market was overbought or oversold. As displayed in the chart above, if speculators were all over the market with their long positions, the oil price increased. On the other, it is also visible that once hedgers start liquidating short positions, the price starts slowly dropping.