MT5 Trading Strategy
| Disclaimer: While due research has been undertaken to compile the below content, it remains an informational and educational piece only. None of the content provided constitutes any form of investment advice. |
The strategy described below is used to trade forex pairs on the MetaTrader 5 platform. It is not adapted to the MT4 because of a property the MT5 has that is lacking in the MT4 platform. This strategy combines elements of a trend indicator and a momentum indicator, operating in the same indicator window. This is one of the benefits that the MT5 platform confers.
The strategy in question is a crossover strategy, with price at the extremes of the vertical range of the oscillator. The trader may also get further confirmation of the price move by identifying a divergence when the Stochastics indicator is in the extreme price areas. Here is a full description of this strategy.
Indicators Used
Two indicators are applied together in the same indicator window. These indicators are the Stochastics oscillator (momentum indicator) and the Ichimoku Kinko Hyo indicator (trend-following).
a) Stochastics is set to 50 (%K), 40 (%D), 2 (i.e., 50,40,2). The horizontal levels on the vertical range in the indicator window are 10, 20, 50, 80, and 90. By default, only the 20 and 80 levels are shown. The trader has to add the other levels manually by double-clicking the indicator, clicking on Properties, and adding the levels. For this demonstration, we have set the colour of the leading indicator line to blue. The signal line is set to white colour, so it remains invisible on the MT5 interface. The Main indicator line is the line that gives us the signal for this strategy.
b) Ichimoku Kinko Hyo is set to 9,26,52 (for Tenkan line, Kijun line and Senkou Span B). The other parameters of this indicator are adjusted as follows:
-
Styles: Tenkan sen is increased to 2 pixels to enhance its visibility. This line's colour is set to red to make it visible. The Kijun sen, Kumo (clouds), and Chikou span are set to white to make them invisible, as only the red Tenkan sen line is relevant to this strategy.
Time frames
The best time frames for this strategy are 15 minutes, 1 hour and 4-hour time frames. You can also perform backtests to determine the most profitable time frame for the currency pair you wish to trade.
The Strategy
A trading strategy entails an entry, trade management, and an exit technique.
The entry point of the strategy is based on the cross of the Main Line of the Stochastics on the Tenkan sen at overbought and oversold levels in the indicator window. The Stochastics window is first opened, then the Ichimoku must be dragged onto the indicator window from the trend indicator field on the Navigator window located on the left of the platform interface. This action attaches the Ichimoku indicator to the Stochastics oscillator, with both indicators appearing on the same window. The adjustments to the indicators are made as presented above.
Sell Signal
Wait for the Stochastics main line to cross below the Tenkan sen at the 80-90 level (overbought). Look for other confluence factors on the chart that support the entry, then open the trade at the start of the next candle. Possible confluence factors include using a divergence signal or trading off a rejection from a resistance level. You can also use a candlestick pattern as a filter for the trade entry.
For the management of the trade, allow the trade to move into profit territory, then use a trailing stop to follow the price move to its logical conclusion or until it retraces against the position.
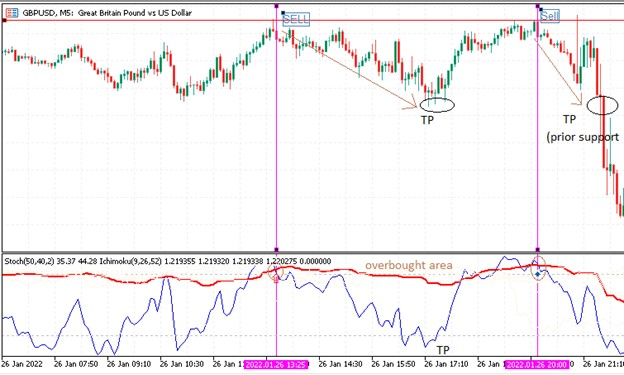
The stop loss should be set at a price level above the entry level, especially if this point is at a resistance level. The exit point for this trade could be at a support level when the indicator lines are now in oversold territory or a reverse cross in the oversold region occurs. The appearance of other price patterns that indicate a potential reversal of the trade are also indicators that point to the wisdom of closing the trades out in profit. The snapshot below indicates what the trade setup looks like.

The snapshot above shows two sell trade setups. The crossover in the overbought region is visible, and we can also see the Take Profit levels. The first TP region was selected as the indicator was already in the opposing price extreme area (oversold area in the indicator window). There is an interesting scenario in the second TP level. Even though the price eventually went further south, the prudent action would have been to exit the trade at the same support level formed by the first TP area. Here's a lesson: in trading, you take what you see on the charts, not what you think the asset will do.
Buy Signal
A buy signal is generated when the Stochastics' main line crosses above the Tenkan sen between the 10 and 20-point levels in the indicator window (i.e. in the oversold area). Ideally, the trade should be taken when the lines start to widen apart after the crossover. The trade should be taken at the opening of the next candle when the crossover is clearly complete.
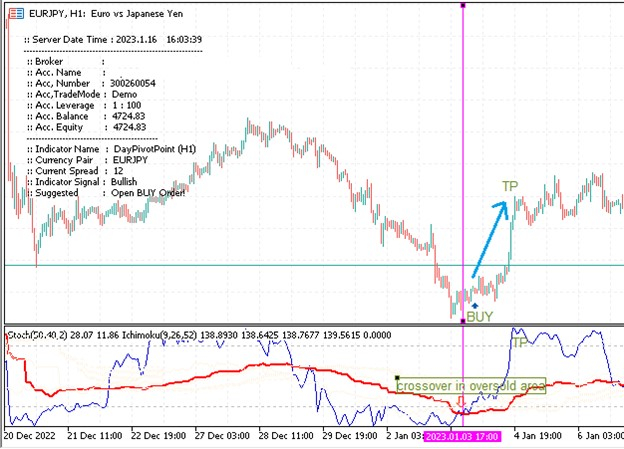
Once the trade is active, the trader can apply a trailing stop once the price has gone a considerable distance into profit. Also, some assets may take some time before the move kicks in, as seen in this example.
Set the Take Profit target at the site of the nearest resistance, or the trade can be closed manually if the indicator line has moved into the overbought area, indicating price exhaustion. A suitable stop loss setting would be at a price level below the site of the lowest low within the ten bars preceding the entry point.

The snapshot shows the response of the asset following the completion of the cross in the oversold area of the indicator window. The TP has been set to correspond to the entrance of the indicator line into the overbought price area.
Conclusion
This strategy has shown to be profitable more often than not. Traders should aim to take trades in which the crossover has occurred in the extreme price areas in the indicator window. Any crossover signals outside the overbought or oversold areas are invalid and should be ignored.
Top-Tier Trusted Brokers
The table below contains links to 3rd party websites of our top partners from whom we receive compensation at no additional cost to you.


