


RSI indicator and a simple trading strategy

Do you know how RSI indicator works? Well, now you are about to find out along with learning a simple and effective trading strategy.
In order for you to successfully trade the RSI indicator you firstly need to understand its principle. RSI is a shortage for Relative Strenght Index and it can have a value from 0 to 100. While values under 30 indicate an oversold market, the values above 70 signalise an overbought market. So simply put, it can help us to determine whether a price of an asset has a higher value than it should have (overbought market) or if the value is lower than it should be - a case of an undersell situation. There are other more in-depth explanations of RSI, but today we will not concern ourself with them, this simple explanation will do the trick for now. Let's get to our draft strategy.
RSI technical analysis - draft strategy
RSI indicator is best to be used along with one other supplementary indicator that will confirm our entry signals. Today, we will use a combination of the RSI along with a stochastic oscillator (link to our article describing its use). In case you haven't read the previous article you might find some difficulties with this strategy because we will continue in our already prepared draft from that article. Once we open the template with the stochastic oscillator we add an RSI indicator. Again delete second line "Moving Average 5", which would only confuse you. After that, click on the RSI indicator settings, choose "edit" and adjust the period from level 50 to level 14. The next step is to create two horizontal lines which we set up to levels 30 and 70. Now all that remains is to attentively wait until the market reaches our established horizontal lines simultaneously on the RSI as well as on the stochastic.
[caption id="attachment_1321" align="aligncenter" width="1605"]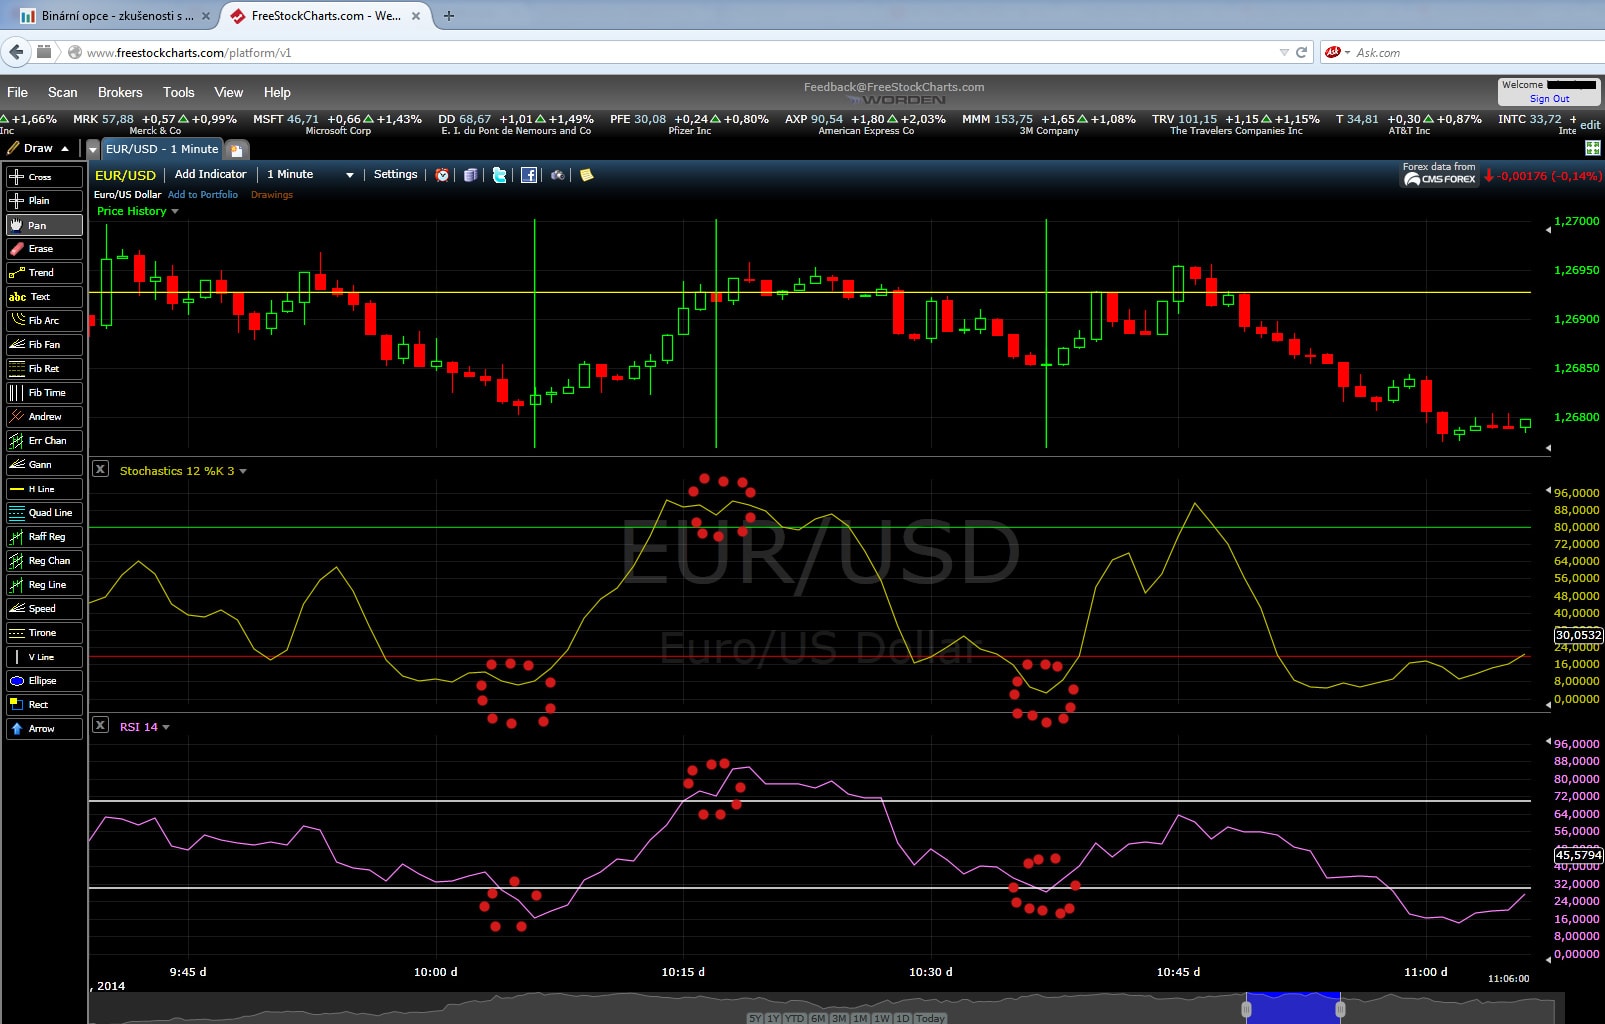 Green vertical lines mark sucesfull trades. Red dots implies crossing both boundaries simultaneously.[/caption]
Once both signals are confirmed at the same time, we might consider moving towards creating a trade. If the stochastic curve is below level 20 and RSI oscillator above level 30, we might think of creating a Call trade (upwards direction). Oppositely, if the curve on stochastic indicator is located above level 80 and RSI above level 70, then we can consider creating a Put trade (downwards direction). When I trade this strategy I usually choose expiration time between 5 to 10 minutes, but you can try your own setting. As you may have noticed, once we added the RSI indicator we received a significantly smaller amount of signals in comparison to using just the stochastic oscillator. That is completely normal because situations which are confirmed by both indicators do not occur on the market so often, but on the bright side, they should theoretically have a better success rate.
RSI trading - quick summary of the strategy
RSI and Stochastic above levels 70 and 80 - we consider to create a Put option - downwards direction
RSI and Stochastic above levels 30 and 20 - we consider to create a Call option - upwards direction
Relative Strenght Index indicator - recommendation
RSI oscillator itself is not suitable for use without additional confirmation indicator. I personally like using RSI along with the stochastic oscillator, but you can pick supportive indicator of your choosing. With a combination of these two indicators I created 85 trades and won 62 of them, so my win.percentage ratio is around 72.94%. But beware that your results may vary and most likely will. Some traders can make even more successful trades with this strategy, but some may not even achieve such results. Therefore I truly recommend to firstly try this strategy on a demo account. Some traders may also use different levels of the indicator than I have mentioned. It depends entirely on you, what values you choose.


Top-Tier Trusted Brokers
The table below contains links to 3rd party websites of our top partners from whom we receive compensation at no additional cost to you.
