Five Metrics to Help You Pick Better Stocks
As the coronavirus cooled the heat of the historic bull market we were in, traders were forced to reexamine the strength of their investments. Sure, in a bull market, making money in equities is easy and we forget that equity investing should be based on solid analysis and reasoning. After all, investing in a stock is to invest in a company’s future and growth. For any trader to have longevity, understanding the key metrics used to evaluate a stock is a must. Today, we are going to cover the five most crucial stock metrics to help you make better investment calls and more consistent plays.
The P/E Ratio – Relative Valuation
The richness or cheapness of a stock is not only determined by its price per share. Some stocks have high share prices, but they are justified by the earnings they generate for investors. Thus, to understand if a stock is overvalued, investors must look at the ratio between share price and earnings.
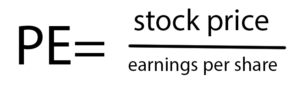
The price-to-earnings ratio (P/E ratio) measures exactly that. By dividing a company’s stock price by its earnings per share, the P/E ratio shows you how much the market is willing to pay for each dollar in earnings the company generates.
 A high P/E ratio can indicate that the stock is overvalued as the market places a high premium on its earnings. Using the P/E ratio, you can compare different investments and assess their relative value despite different stock prices. However, the P/E ratio is only useful when you compare two companies in the same industry. Different sectors have different average P/E ratios because of their unique business models.
The PEG Ratio – Relative Value with Growth
While the P/E ratio is useful in determining a stock’s relative cheapness, it doesn’t consider the company’s future growth potential. Two stocks could have the same P/E ratio but their future growth can vary drastically. A company with a higher growth rate is likely to offer more value to investors.
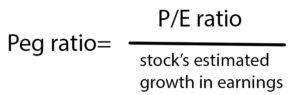
To capture growth in stock valuation, investors can use the price/earnings to growth ratio (the PEG ratio). The PEG ratio divides the P/E ratio by the stock’s estimated growth in earnings.
As a result, companies with high estimated growths will have lower PEG ratios while stocks with low growth rates will appear more expensive with higher PEG ratios. The PEG ratio presents a more holistic method to compare the relative value of stocks. But it is not perfect. Because the estimated growth rate is only a forecast and not set in stone, the PEG ratio of a company can vary based on the growth rate assumption. Consequently, it is best to use the P/E and PEG ratio together to get a better picture of the relative cheapness of an individual stock.
Beta – Exposure to Systematic Risks
When selecting an individual stock, it’s always a good idea to understand how it would respond to the movements of the stock market as a whole. For example, when the market sells off, is this stock going to have a big loss or remain strong?
There is useful metric investors use to gauge the level of correlation between a stock and the wider market – beta. Beta is essentially the slope in a regression. It shows investors how much a stock would move when the S&P changes by 1%, based on historical data. When a stock has a beta of 1, it is likely to repeat the performance of the market. When the beta is greater than 1, the stock will experience more volatility than the market. A negative beta means that the investment moves in the opposite direction of the stock market.
Beta clarifies the potential level of volatility of your investment. A high beta means that the stock is more volatile and a low beta means that the stock is more stable. As with the P/E ratio, beta changes from sector to sector. Defensive stocks tend to have lower betas while high tech stocks have higher betas.
The Debt to Asset Ratio – Financial Leverage
With companies like Sears going out of business, many began to pay attention to a company’s debt level as an indicator of its financial health. Taking out debts is one way a company finances its expansion and operation. However, debts reduce profitability as the company spends cash to cover quarterly interest payments. Debt obligations also make the company vulnerable to changing market environments such as a recession.
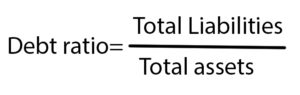 The degree a company uses debts to finance its operation can be measured by the debt to asset ratio. You can calculate this ratio by dividing a company’s total debts (short-term and long-term) by its total assets. A company with a high debt to asset ratio has more liabilities and tends to spend more money servicing its debts. In general, a low debt to asset ratio is preferred.
Free Cash Flow – Profitability
Lastly, a business is only worth investing in when it is effective in generating cash. With more available cash, a company is more likely to pay dividends, invest in R&D, expand its operation, and refinance its debts. Cash is king in life and business operation. Free cash flow (FCF) allows investors to understand exactly how much cash a business is producing. And it is a very effective measure of profitability. You can calculate a company’s free cash flow by subtracting its capital expenditure from its operating cash flow.
The trend of a company’s free cash flow is more important than its absolute value. An increase in free cash flow shows that the company is becoming more efficient in its operation. This could result from cost reduction or growth in sales. A positive free cash flow growth thus signals that the stock price of a company could be on the rise.
However, like any fundamental variable, FCF has its limitations. Because FCF takes into account of capital expenditure, it can take a dip when the company purchases expensive production equipment. Thus, investors should account for a company’s capital expenditure when contextualizing its free cash flow.

Top-Tier Trusted Brokers
The table below contains links to 3rd party websites of our top partners from whom we receive compensation at no additional cost to you.