Fibonacci trading explained - How to draw Fibonacci levels
It is well known that every market moves by impulses and setbacks, whether index, commodity, currency or stock. No matter the title of the asset, all have a similar pattern in terms of trend building. Given this behaviour, it is necessary to study the similarities offered by price movements over time.
The corrections and the impulses or sections have a certain historical harmony that obeys an order that can be delimited with the backs and projections of Fibonacci. To understand this, we must first define what or who is Fibonacci and what its possible use in the world of trading. Fibonacci was an Italian mathematician (c. 1170-1250) famous for spreading the so-called "Fibonacci sequence", a sequence that begins with 0 and 1 and from these, each number is the result of the sum of the two previous ones. In this way, it achieved a golden spiral with characteristics that are applied to various areas of life, among them; galaxies, flowers, sea waves, body parts of humans ... and of course in the financial markets.
In trading, these proportions, especially 61.8 and 38.2, will mark us areas of support and resistance, both in setbacks and projections. To do this, all trading platforms should allow us to draw the Fibonacci and we will always do in finished trends, where the beginning will be 0 and the end 100. Between these two values will be the setbacks (38.2 and 61.8) And above / below (depending on whether it is bullish or bearish) extensions.
Setting parameters
To apply Fibonacci we must have several factors in mind. The fact of detecting a trend well and tracing its setbacks and projections will not give us a trading system. We have to give rules to the operative, rules based on statistics that give us favourable odds against the market. We will call these rules patterns. First of all, let's look at practical examples of how to draw Fibonacci on a market and what setbacks and extensions represent. Remember that the market is fractal and that the operation of the strategy is the same for any temporality in which it is used, whether they are one-minute charts or daily charts. The proportion in the markets is truly staggering.
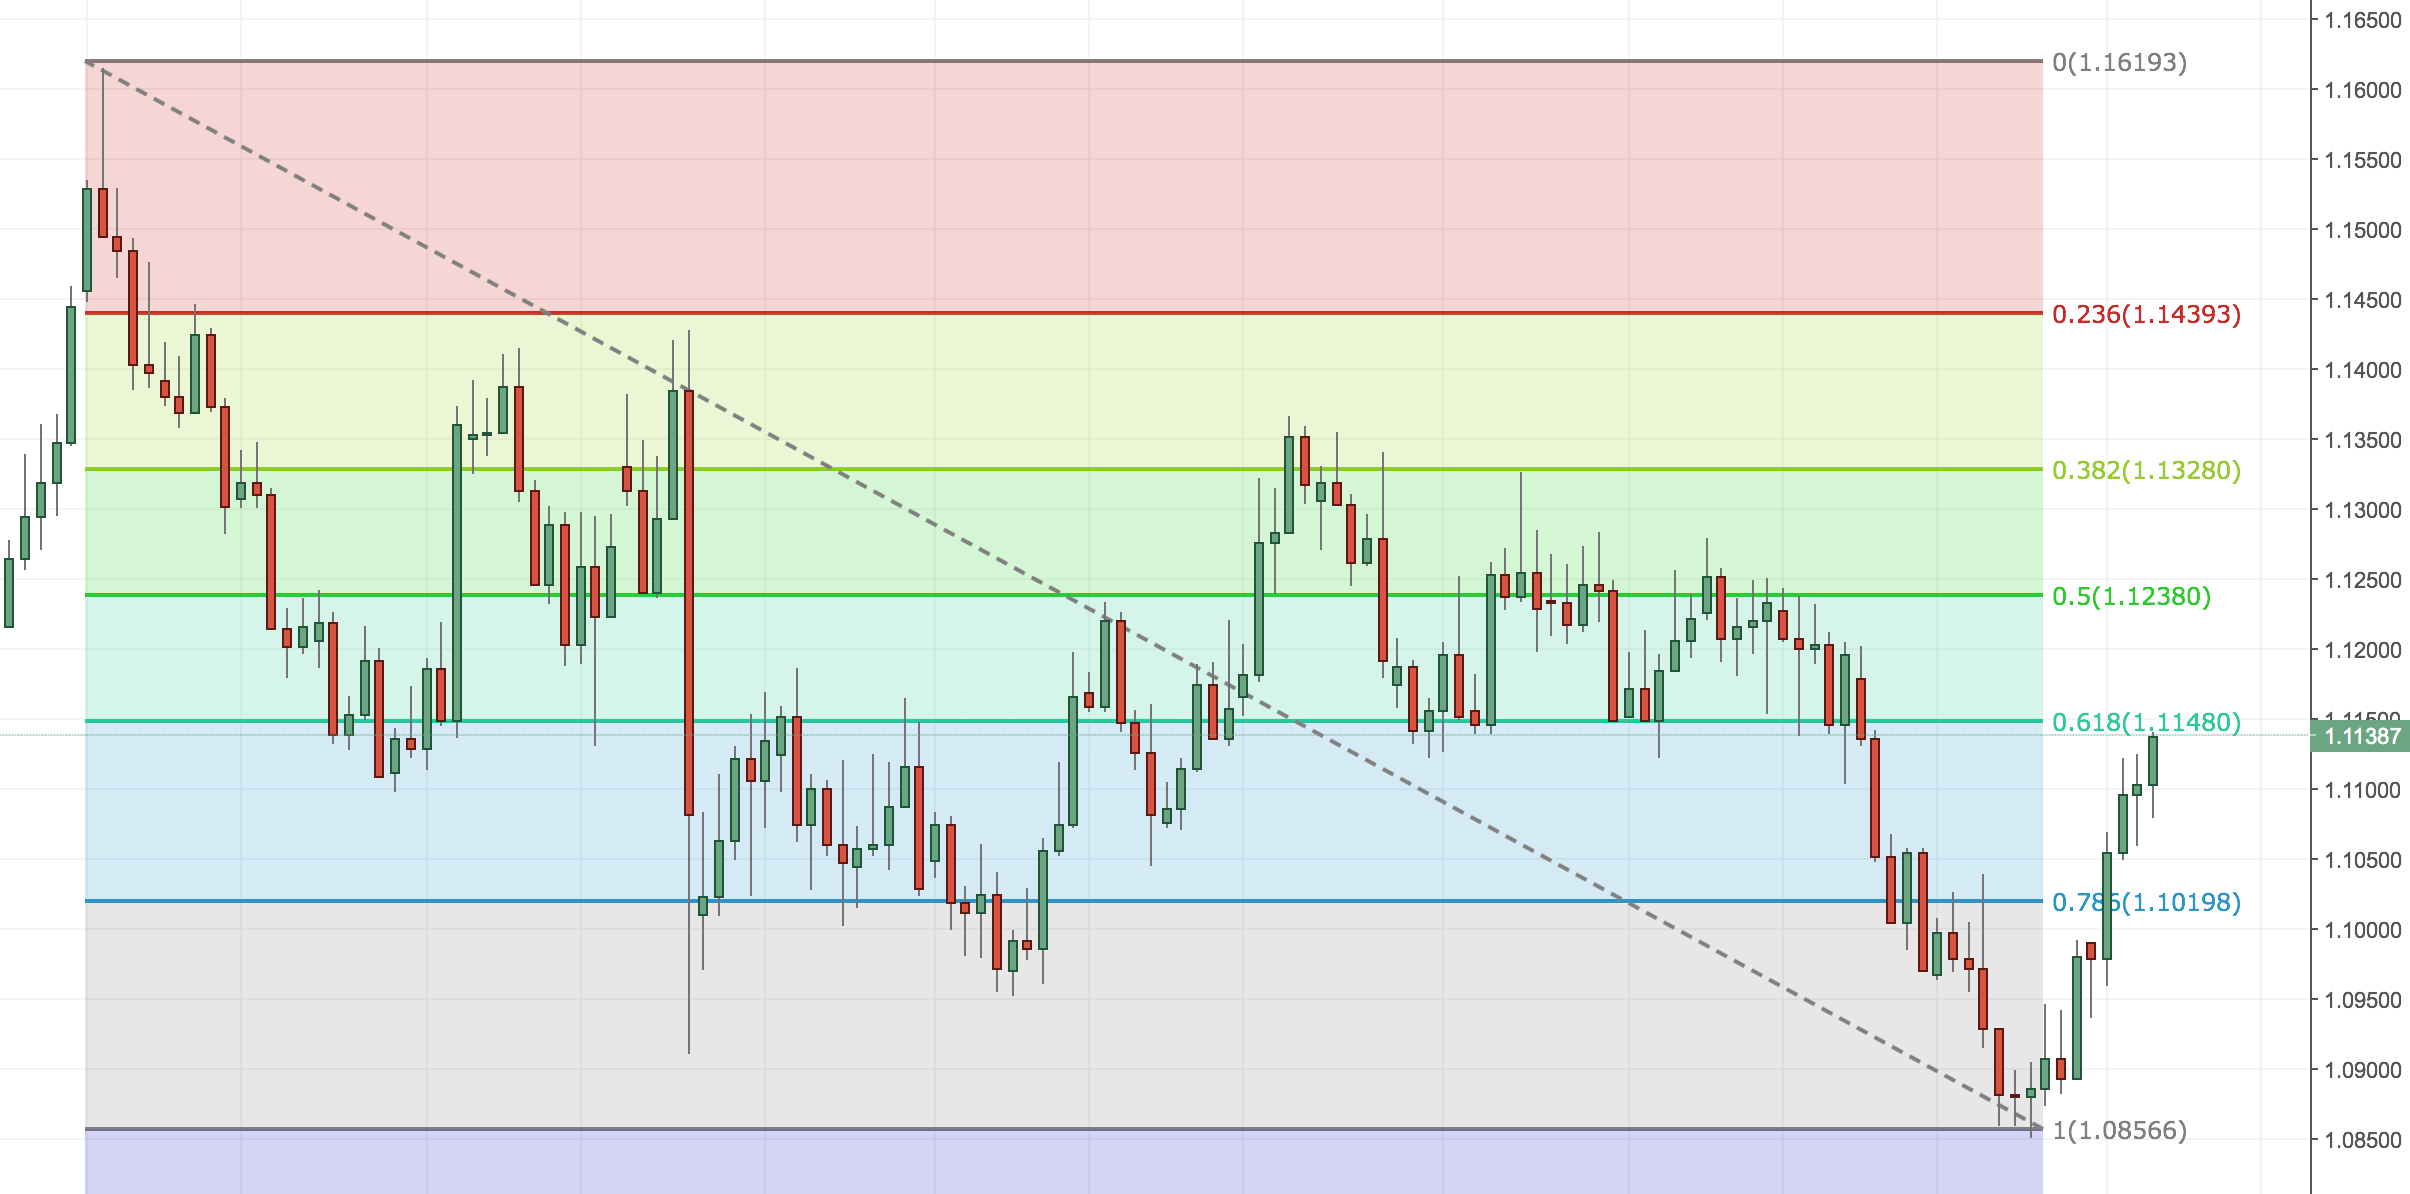
If it is a downtrend the 0 goes on the roof and the 100 on the floor. We have two impulses with their respective corrections fixed as the Fibonacci I draw the setbacks 61.8 and 38.2, these levels are important areas that must be taken into account. Any platform will give you the following setbacks: 0.00% 23.60% 38.20% 50.00% 61.80% 76.40% and 100.00%. As I said, those levels represent very important operational zones that we must always monitor because we can leave points of entry and exit.
Let's go over some basic considerations:
- If an impulse has a regression less than or equal to 38% it is considered to be strong and there are high chances of reaching new highs.
- If an impulse goes back to 62%, it is considered weak and the new impulse is not
likely to exceed previous peaks.
- If an impulse has a setback above its 62% we speak of a change of trend or a market
turn.
Entry guidelines
After defining the main parameters and aspects of Fibonacci, we will investigate the operational strategy that offers us. We know that the regressions 38.2 and 61.8 are statistically important areas in trading, especially to define the end of corrections. When we detect a market momentum in trend, we do not care if it is bullish or bearish, we have to start thinking about how to get on the wave. To do this, we must wait for the correction to develop that allows us to obtain a good input timing. But how far can correction come? Here is the eternal question. Fibonacci will help us find the end of the corrections and the beginning of new impulses.
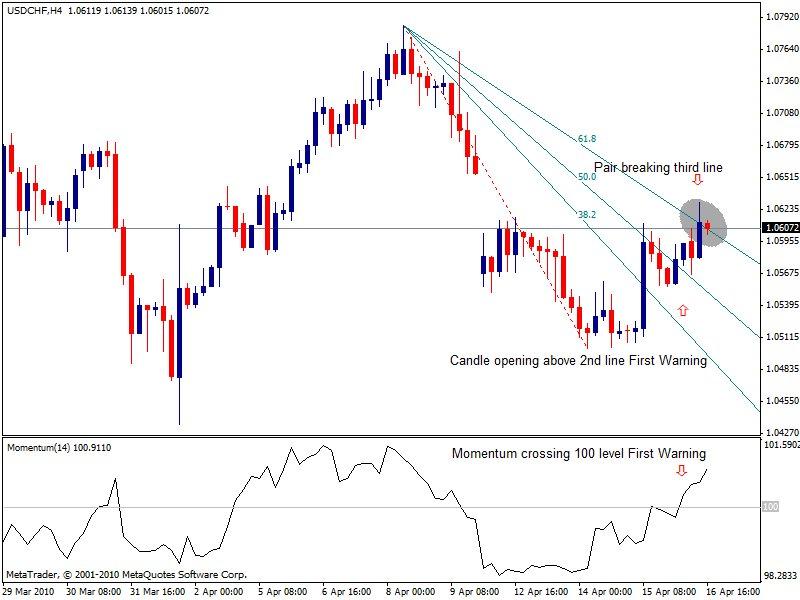 Let's see how: First, we must look for confluences between the setbacks: supports, resistances and guidelines. That is, we will find price levels where there are setbacks (either 61.8 or 38.2) and the mentioned key levels. We may have double confluences, where the regression coincides with a key level, or triple confluences, where the regression coincides with two key levels. These confluences will leave us operational zones, evidently, the triple confluences will have more force than the doubles.
Conclusions
- The most effective Fibonacci setbacks are 38.2 and 61.8.
- The strategy should always be combined with adequate monetary management.
- The more levels of confluence, the better the input will work.
- The market is fractal, therefore, the strategy should work any temporality.
- The strategy can be applied in any market, the price always behaves the same
(impulse-correction-impulse).

Top-Tier Trusted Brokers
The table below contains links to 3rd party websites of our top partners from whom we receive compensation at no additional cost to you.