


Simple, yet effective strategy with stochastic oscillator

By using illustrative examples we will teach you a simple trading strategy just by applying a stochastic oscillator.
Stochastic Oscillator (or indicator) shows us when the market has the tendency to turnover. The indicator ranges from level 0 to 100. Usually, the oscillator has pre-set 2 horizontal lines, which are located on levels 80 (green line), 30 (red line). We won’t bore you with some unimportant facts about stochastic oscillator. We will be rather moving straight on one specific strategy which I have been using for quite some time with huge contentment.
Adding stochastic oscillator into the chart
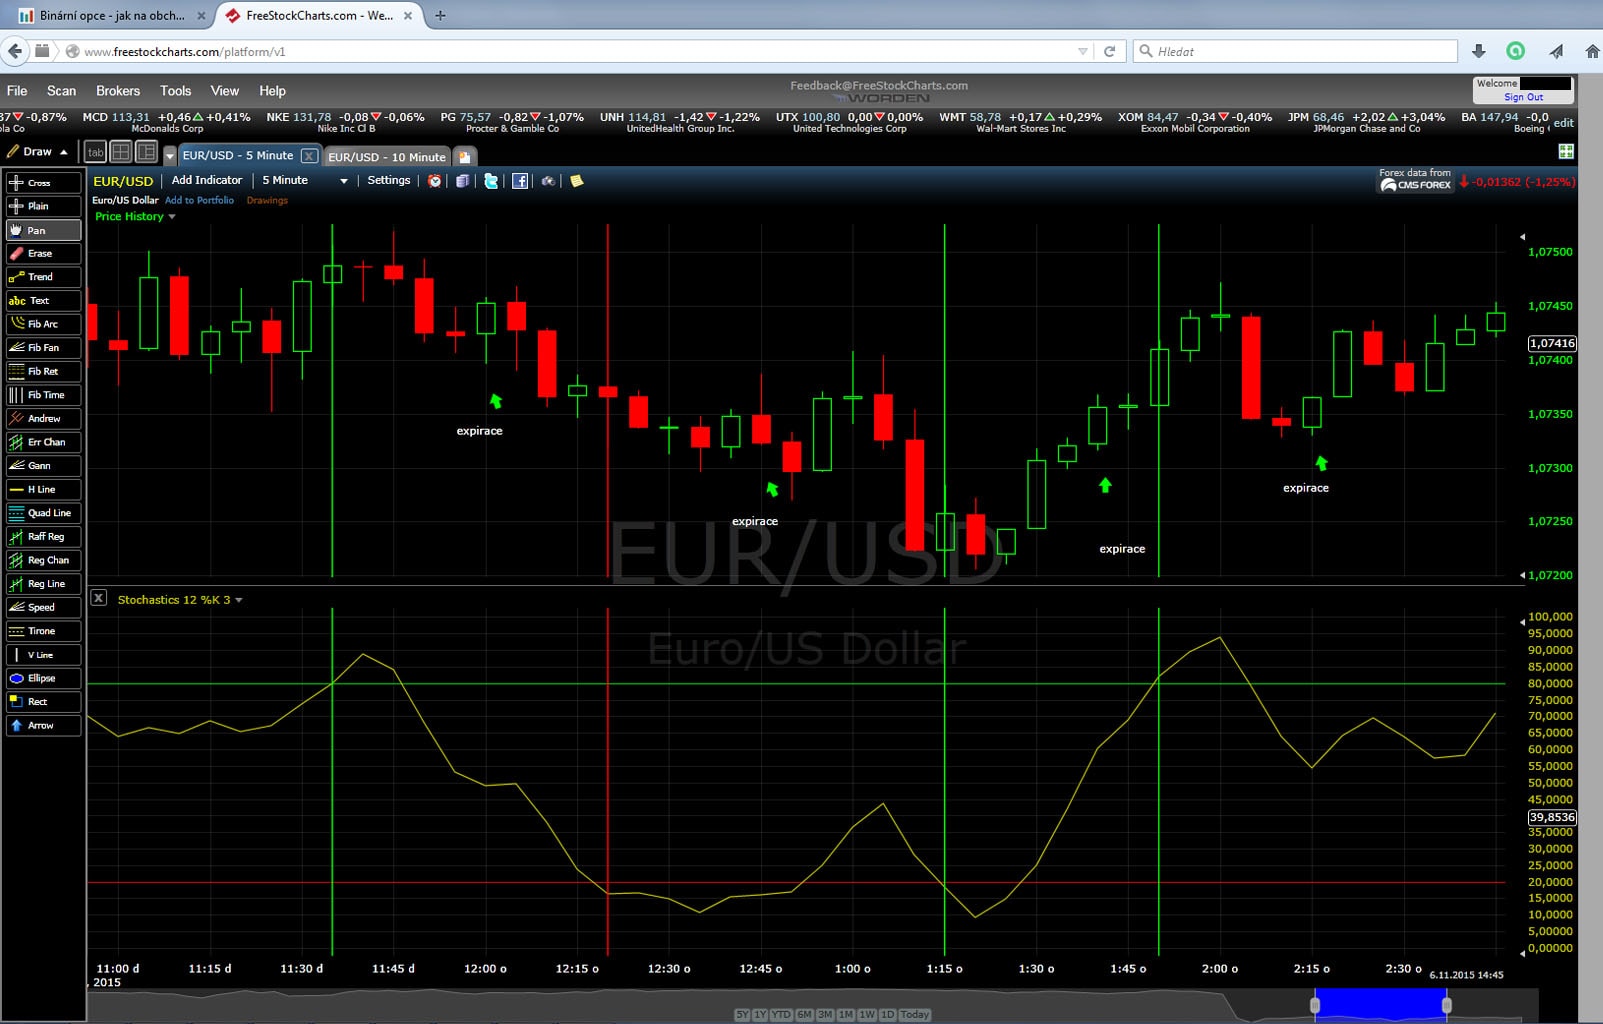
Firstly, we select a service or program that will serve us for technical analysis. For our demonstration we chose freestockcharts, which is an online website used for charting, its usage is free. On this platform, we choose an asset we want to trade. We have selected the classic, currency pair EUR/USD. At this point, we change the timeframe for 5 minutes and we add the stochastic indicator. By doing so, we will have underneath our price graph the stochastic indicator which will be composed of 2 curves. However, we will be using only the first curve, therefore the other one - 5% D just simply remove (left click on its name and remove). Now your chart should look very alike this. (Of course without the vertical curves).
Simple, yet effective strategy with stochastic oscillator
We have already set up the graph, so we can move right away into our strategy with the stochastic indicator. Our full attention should be put into the time when the curve crosses the green horizontal line (level 80), or when it goes below level 20 (red horizontal line). When I trade this strategy I am usually choosing a 5 minute expiration time, however, you can try to experiment by using another expiry times, this step is totally up to you.
In our case, the creation of a trade is marked by a long vertical line, the colour differs according to whether the trade was successful or not. The green line indicates profitable trade and the red line oppositely a losing investment. In this demonstration, I created 4 trades (three of them were successful, just one was unprofitable). Therefore in this example, the success rate of this strategy is 75%. Nevertheless in order to get an objective winning ratio of this strategy you need to test it on a lot of trades (at least 100+).
Summary – when to consider opening a position
The value of the stochastic oscillator rose above level 80. In this case, we are considering the purchase of a put option (or going for a short position in case of Forex/CFD). It is possible that the price will go down.The value of the stochastic oscillator fell below level 20. In this case, we are considering the purchase of a call option (or going for a long position in case of Forex/CFD). It is possible that the price will go up.Recommendation and usage of this strategy
Before using this strategy on a real account with real funds I strongly encourage you to test it firstly on a demo account. Try to make as many trades as possible there. Once you get the feeling that this trading style really suits you, then you can just jump on a real account. This indicator is not suitable for a trending market, or at least not without using another indicator along.


Top-Tier Trusted Brokers
The table below contains links to 3rd party websites of our top partners from whom we receive compensation at no additional cost to you.
