


3 Best Charts for Forex Trading
Forex trading relies heavily on accurate data analysis, and choosing the right charts is essential for making informed trading decisions. With the forex market's constant fluctuations, traders need tools that help visualize price movements, identify trends, and spot potential trading opportunities. Whether you're a short-term trader or looking for long-term trends, using the right chart can significantly improve your market analysis.
Why charts are essential in forex trading
Charts are an indispensable tool for forex traders as they provide a visual representation of price movements over time. By analyzing charts, traders can identify patterns, trends, and potential entry and exit points. Choosing the right chart type allows traders to develop more effective strategies and minimize risk.
Each chart type offers unique insights, and understanding how to use them correctly can help traders make better trading decisions. The three most commonly used charts in forex trading are:
- Line charts – Simple yet effective for identifying trends.
- Bar charts – Detailed analysis of price movements.
- Candlestick charts – Popular for their comprehensive visual representation of market sentiment.
Let's take a closer look at each of these charts and how they can benefit forex traders.
1. Line charts in forex trading
What is a line chart?
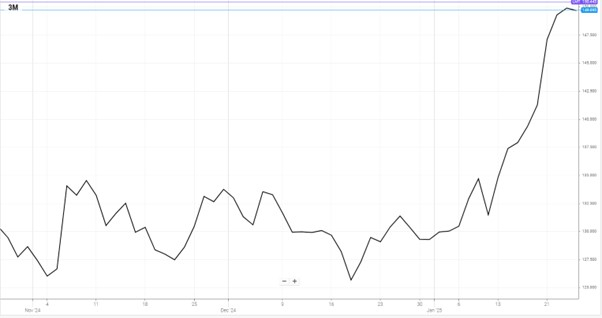
A line chart is one of the simplest and most commonly used chart types in forex trading. It connects a series of data points with a continuous line, usually representing closing prices over a specific period. This type of chart provides a clear and straightforward view of the overall market trend.
Why use a line chart?
Line charts are beneficial for traders who prefer a simplified view of market movements without too much noise. They are particularly useful for:
- Identifying long-term trends.
- Comparing price movements over different timeframes.
- Analyzing key support and resistance levels.
How to use a line chart effectively
To maximize the effectiveness of a line chart in forex trading, traders should focus on identifying the general direction of the market rather than short-term fluctuations. Using line charts in combination with other indicators, such as moving averages, can further enhance trend analysis and confirm potential trading opportunities.
2. Bar charts in forex trading
What is a bar chart?
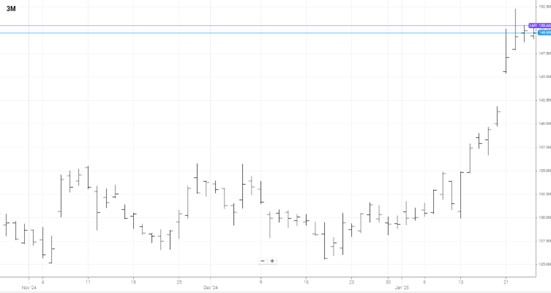
A bar chart provides more detailed information compared to a line chart. Each bar represents a specific timeframe and includes four key data points: the opening price, closing price, highest price, and lowest price. This additional information helps traders gain a better understanding of market dynamics.
Why use a bar chart?
Bar charts are favored by traders who require a more detailed view of market movements. They are useful for:
- Analyzing volatility within specific timeframes.
- Identifying price ranges and patterns.
- Assessing potential breakout points.
How to interpret a bar chart
Each vertical bar on a chart represents a specific period of trading. The top of the bar indicates the highest price reached, while the bottom represents the lowest. The horizontal tick on the left side of the bar shows the opening price, and the right-side tick indicates the closing price. Traders can use this information to gauge market momentum and identify potential entry or exit points.
3. Candlestick charts in forex trading
What is a candlestick chart?
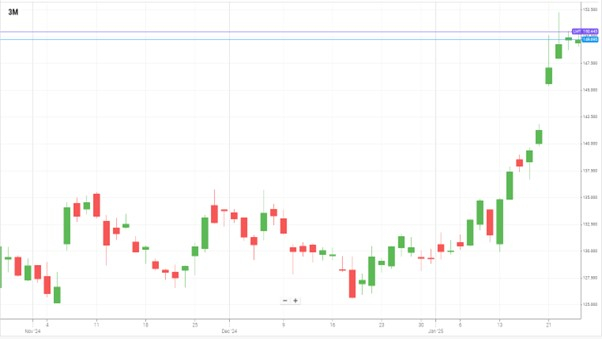
Candlestick charts are the most widely used chart type in forex trading due to their comprehensive and visually appealing format. Each candlestick represents a specific timeframe and displays the opening, closing, high, and low prices. The body of the candlestick is colored to indicate whether the market moved up or down during that period.
Why use a candlestick chart?
Candlestick charts offer valuable insights into market sentiment and are beneficial for:
- Recognizing bullish and bearish patterns.
- Identifying trend reversals.
- Understanding market psychology and momentum.
Key candlestick patterns to watch
Some commonly used candlestick patterns that traders rely on include:
- Doji: Indicates market indecision and potential reversals.
- Hammer: Signals possible trend reversals in a downtrend.
- Engulfing pattern: A strong reversal signal, where one candlestick fully engulfs the previous one.
By mastering candlestick patterns, traders can better anticipate price movements and refine their forex trading strategies.
Choosing the right chart for your forex trading strategy
Selecting the appropriate chart type depends on your trading style and objectives.
For trend-following traders, line charts provide a simplified view of market direction.
For detailed analysis and range trading, bar charts offer valuable insights into market volatility.
For pattern recognition and sentiment analysis, candlestick charts provide the most comprehensive information.
Traders should experiment with different chart types and timeframes to find what works best for their strategy.
How to incorporate charts into your forex trading routine
Integrating charts into your trading routine requires consistency and discipline. Here are some tips to maximize their effectiveness:
- Set up a consistent analysis schedule – Regularly review charts before making trading decisions.
- Combine charts with technical indicators – Use moving averages, RSI, and MACD to gain deeper insights.
- Monitor multiple timeframes – Analyzing charts over different periods can help identify long-term trends and short-term opportunities.
- Stay informed about market news – Economic events and geopolitical developments can impact chart patterns and market behavior.
By following these steps, traders can build a structured approach to market analysis and make more informed trading decisions.

Top-Tier Trusted Brokers
The table below contains links to 3rd party websites of our top partners from whom we receive compensation at no additional cost to you.